Network analyst is one of the most powerful tools in GIS software, allowing planners to generate isochrones (maps showing how long it takes to travel to or from a given point). These isochrones can then be used to show the impact of proposed service alternatives. However, in order to make an accurate isocrhone, the underlying network database must be set up to reflect realistic travel conditions. I have experience creating robust, multimodal network databases that have been used to generate isocrhones for a variety of purposes.
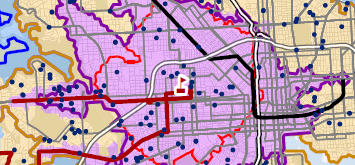
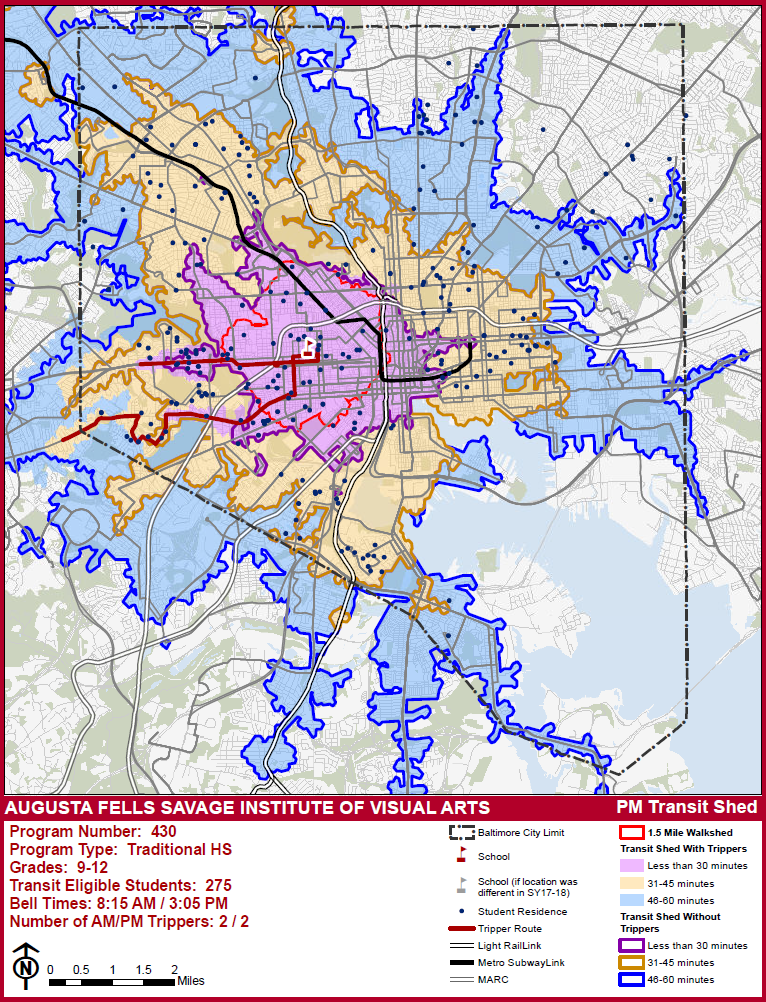
Isochrone showing travel times with and without the availability of supplemental school service for a Baltimore City Public School. The design standards I established while creating this map transferred to other projects of a similar nature. (Click to enlarge)
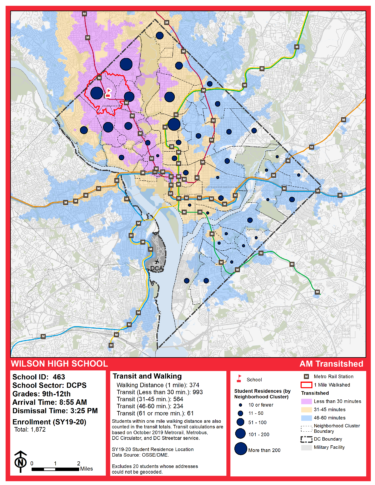
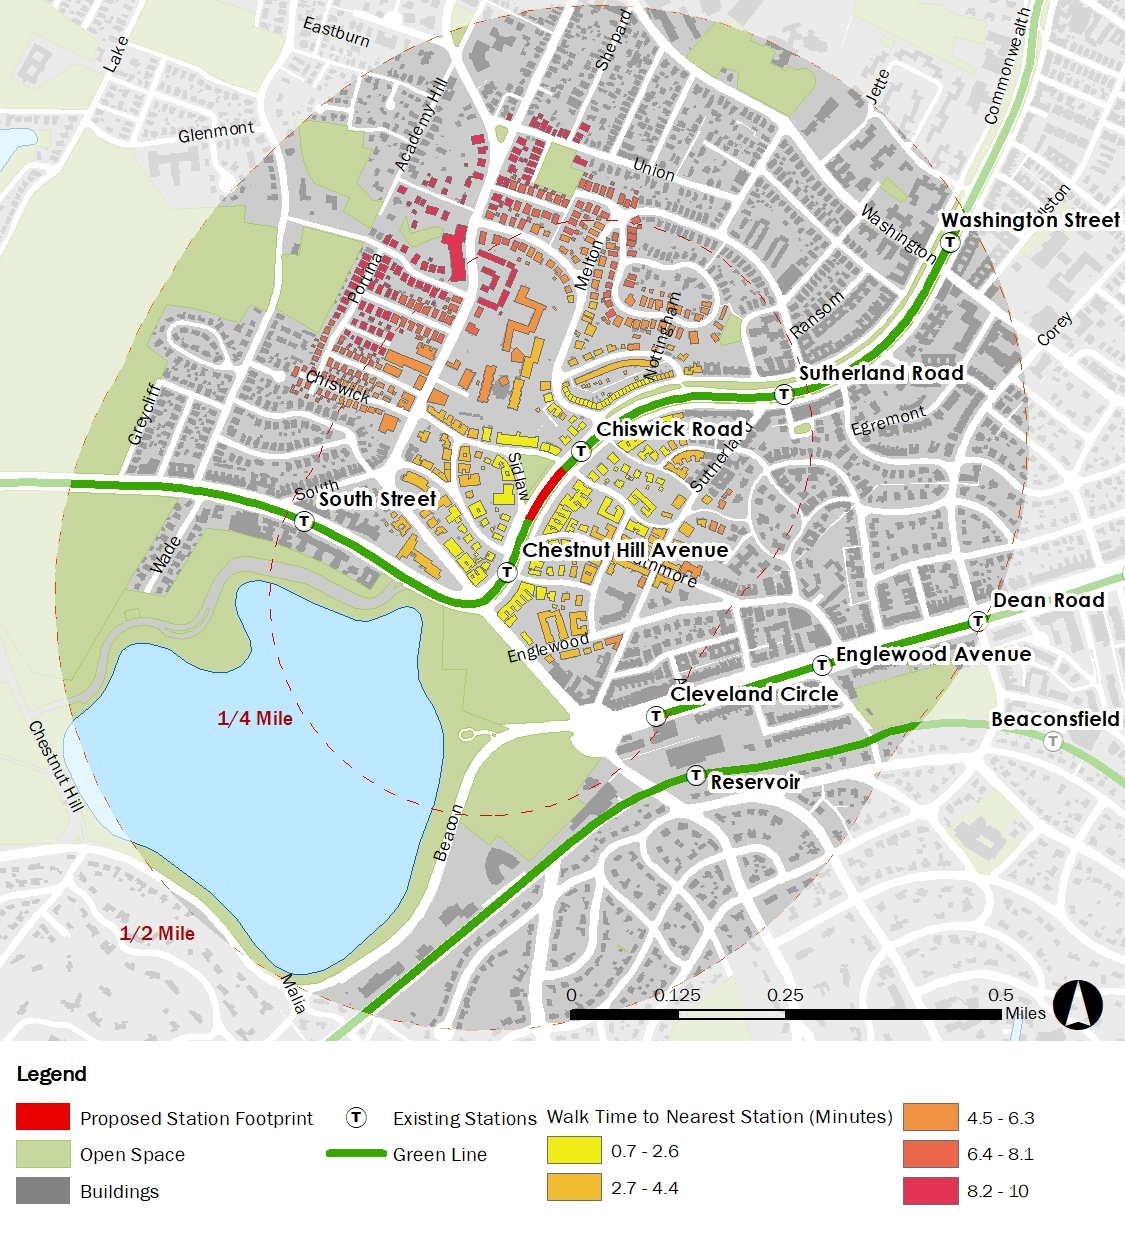
Isochrone showing travel times with and without the availability of supplemental school service for a District of Columbia Public School. The map is based off the map design used for Baltimore, but modified to show the data the client wished to highlight. Additionally, the presentation of some data was modified to address privacy concerns. (Click to enlarge)For a proposed consolidation of stops along the MBTA Green Line’s B and E branches, I generated maps using Network Analyst showing the change in walk time from individual buildings to the new station location. This sample demonstrates the type of detailed analysis that can be completed with access to the right data sources and the knowledge of how to leverage that data for those purposes. (Click to enlarge)